
Overview
Key benefits
- Track workspace usage across chats, Agents, Workflows, and the nuwacom API.
- Review central workspace metrics, including users, Agents, Workflows, and documents.
- Compare activity over time by grouping data by day, week, or month.
- Export chart data as CSV for analysis in Excel, reporting tools, or internal reports.
When to use Analytics
Analytics help admins understand how a workspace is used over time. The area supports usage reviews, internal reporting, adoption tracking, and function-level analysis across Chat, Agents, Workflows, and API usage.How to view analytics data
- Open Workspace settings.
- Select Analytics.
- Choose an analytics tab.
- Set the Date range and Group by filters.
Setting the date range and grouping
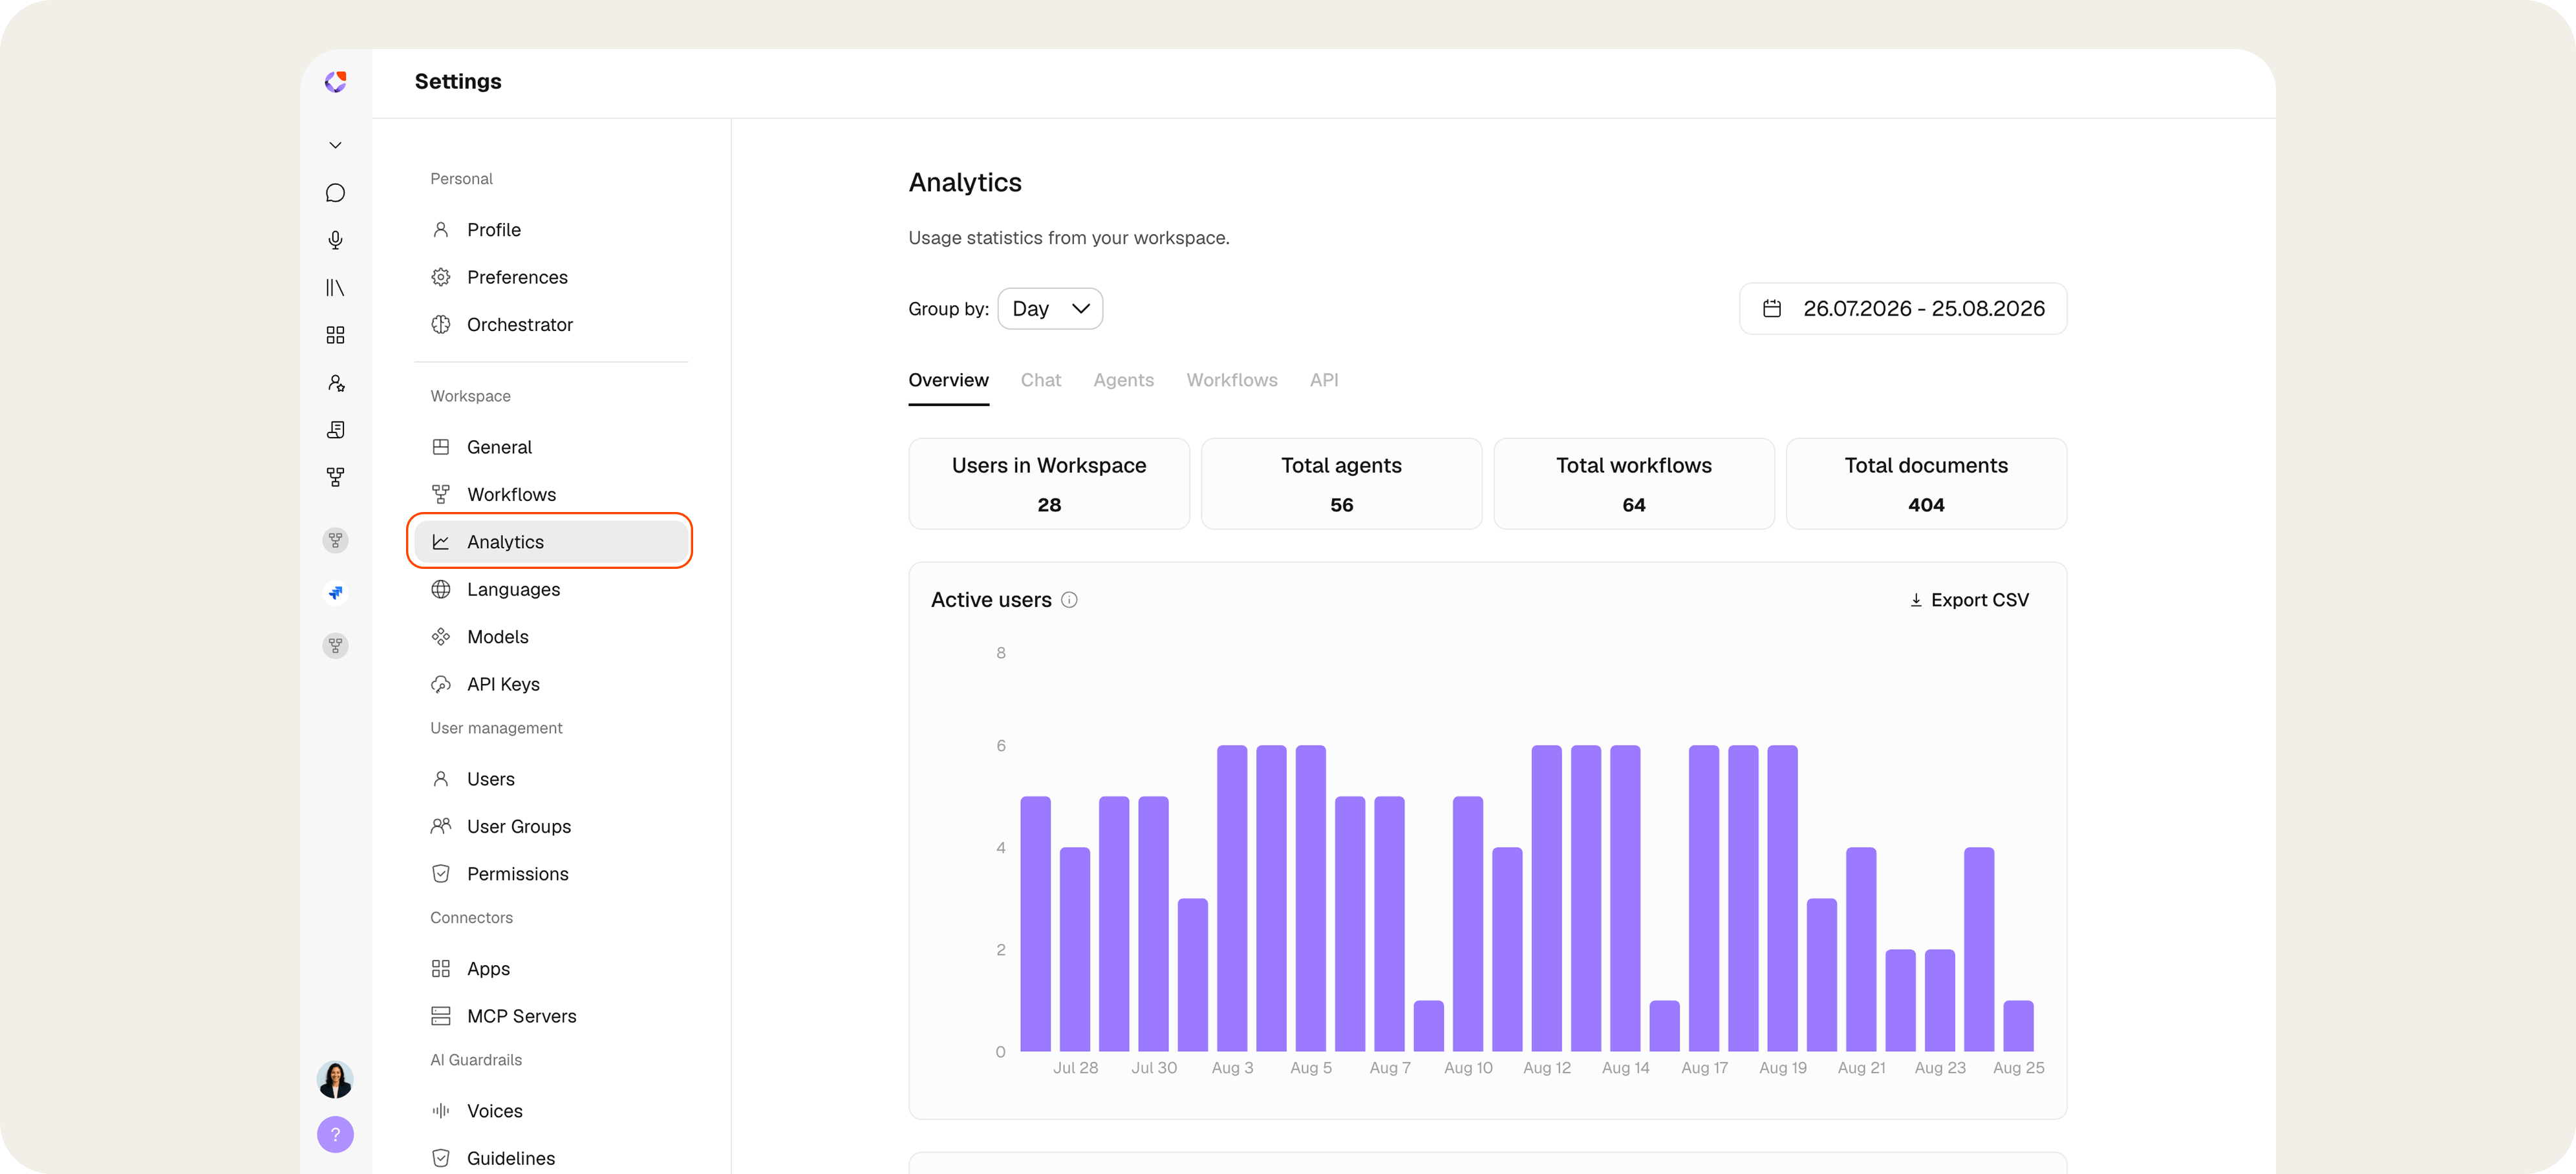
The filters above the analytics view control how data appears across charts and metrics. When a filter changes, all affected charts and metrics update based on the selected settings.Group by
Group by defines the time interval used to aggregate the data. Available examples include day, week, and month.Date range
Date range defines the period used for the usage statistics. Available examples include today, last week, and a custom range.Analytics areas
The Analytics area contains separate tabs for different evaluation areas. The available tabs are Overview, Chat, Agents, Workflows, and API.Overview
The Overview tab shows central workspace metrics. These include Users in workspace, Total Agents, Total Workflows, and Total documents.
Moving the cursor over a chart bar displays the exact value for the selected point in time.
Chat
The Chat tab shows how Chat was used within the selected date range. The data follows the selected grouping, for example by day.
Message-based metrics count user messages. Generated AI answers are reflected separately in model usage metrics.
Agents
The Agents tab shows how Agents were used within the selected date range. Evaluations follow the selected date range and grouping, for example by day.Workflows
The Workflows tab shows how Workflows were executed within the selected date range and which status each execution ended with. The data follows the selected date range and grouping, for example by day. The status overview summarizes the main execution statuses above the chart.API
The API tab shows usage of the nuwacom API within the selected date range. The evaluation follows the selected date range and grouping, for example by day.Exporting data
Select Export CSV on a chart to download the data currently represented by that chart. Each export contains one row per data point (for example, one row per model) and the corresponding aggregated count for the selected date range. The filename includes the chart type and the selected time period. The exported data can be processed outside nuwacom, for example in Excel, a reporting tool, or internal analyses.Additional metric information
The information icon next to an evaluation opens a short description of the corresponding metric. This helps verify what a chart or metric represents before the data is used in reports.FAQ
Who can access Analytics?
Who can access Analytics?
The Analytics area is visible only to workspace admins. Open Workspace settings, then select Analytics.
Which areas can be evaluated in Analytics?
Which areas can be evaluated in Analytics?
Analytics includes Overview, Chat, Agents, Workflows, and API. These areas provide general workspace metrics as well as insights into individual functions.
Which API usage is displayed?
Which API usage is displayed?
The API tab shows the total number of API calls and their development over the selected date range. This shows when the API was used and how usage changed.
How can the date range and grouping be changed?
How can the date range and grouping be changed?
Use the filters above the analytics view. Select a date range such as today, last week, or a custom range. Group the data by day, week, or month.
Can Analytics data be exported?
Can Analytics data be exported?
Data from each chart can be exported individually as a CSV file. The export reflects the selected date range and grouping. The file can then be used in Excel, reporting tools, or internal analyses.
Can admins view usage data for individual users based on their email addresses?
Can admins view usage data for individual users based on their email addresses?
No. For data protection reasons, nuwacom does not provide usage data at the level of individual users or email addresses. All metrics are displayed in anonymized and aggregated form only.To assess individual license usage, teams can use internal discussions or surveys as an additional source of information.
Does Analytics include usage from embedded chats or widgets?
Does Analytics include usage from embedded chats or widgets?
No. Analytics currently only includes usage within the nuwacom platform. Requests made through embedded chats or widgets via iFrame are not included in the Analytics data.